
Overview
- Introduction
- Authentication
- Querying
- Bulk Downloads
- Frequently Asked Questions
Data Tables
- Indicator Descriptions
- Fundamentals
- Stock Prices
- Fund Prices
- Corporate Actions
- Material Corporate Events
- S&P500 Constituents
- Price Based Metrics
- Insiders
- Tickers and Metadata
- Daily Fundamentals
- Institutional Investors
- Institutional Investors Summary by Ticker
- Institutional Investors Summary by Investor
Fundamentals
More than 100 fundamental indicators for nearly 18,000 active and delisted US public companies. Covers the primary class of common stock securities. Point-in-time/As-Reported financials available via AR dimension observations (ARQ/ARY/ART). Most-Recent-Reported financials available via MR dimension observations (MRQ/MRY/MRT). 99% survivorship bias free. Deep history to 1998.
Table details
Delivery Frequency
Daily at 17h30 and 23h30 US Eastern (ET)
Data Frequency
Quarterly, Annual & Trailing twelve months
Reporting Lag
< 1 day
History
January 1998
Coverage
Common stock securities (primary class) that are active or delisted from Nasdaq, NYSE or NYSEMKT
Included in
Fundamentals, Bundle
Alias
SF1
View table
Explore table metadata
| Indicator Name | Indicator Code | Unit Type | Primary Key | Filter | More |
|---|---|---|---|---|---|
Ticker Symbol | ticker | text | Y | Y | |
Dimension | dimension | text | Y | Y | |
Calendar Date | calendardate | date (YYYY-MM-DD) | N | Y | |
Date Key | date | date (YYYY-MM-DD) | Y | N | |
Report Period | reportperiod | date (YYYY-MM-DD) | Y | N | |
Fiscal Period | fiscalperiod | date (YYYY-MM-DD) | N | N | |
Last Updated Date | lastupdated | date (YYYY-MM-DD) | N | Y | |
Accumulated Other Comprehensive Income | accoci | currency | N | N | |
Total Assets | assets | currency | N | N | |
Average Assets | assetsavg | currency | N | N | |
Current Assets | assetsc | currency | N | N | |
Assets Non-Current | assetsnc | currency | N | N | |
Asset Turnover | assetturnover | ratio | N | N | |
Book Value per Share | bvps | currency/share | N | N | |
Capital Expenditure | capex | currency | N | N | |
Cash and Equivalents | cashneq | currency | N | N | |
Cash and Equivalents (USD) | cashnequsd | USD | N | N | |
Cost of Revenue | cor | currency | N | N | |
Consolidated Income | consolinc | currency | N | N | |
Current Ratio | currentratio | ratio | N | N | |
Debt to Equity Ratio | de | ratio | N | N | |
Total Debt | debt | currency | N | N | |
Debt Current | debtc | currency | N | N | |
Debt Non-Current | debtnc | currency | N | N | |
Total Debt (USD) | debtusd | USD | N | N | |
Deferred Revenue | deferredrev | currency | N | N | |
Depreciation Amortization & Accretion | depamor | currency | N | N | |
Deposit Liabilities | deposits | currency | N | N | |
Dividend Yield | divyield | ratio | N | N | |
Dividends per Basic Common Share | dps | USD/share | N | N | |
Earning Before Interest & Taxes (EBIT) | ebit | currency | N | N | |
Earnings Before Interest Taxes & Depreciation Amortization (EBITDA) | ebitda | currency | N | N | |
EBITDA Margin | ebitdamargin | ratio | N | N | |
Earnings Before Interest Taxes & Depreciation Amortization (USD) | ebitdausd | USD | N | N | |
Earning Before Interest & Taxes (USD) | ebitusd | USD | N | N | |
Earnings before Tax | ebt | currency | N | N | |
Earnings per Basic Share | eps | currency/share | N | N | |
Earnings per Diluted Share | epsdil | currency/share | N | N | |
Earnings per Basic Share (USD) | epsusd | USD/share | N | N | |
Shareholders Equity Attributable to Parent | equity | currency | N | N | |
Average Equity | equityavg | currency | N | N | |
Shareholders Equity (USD) | equityusd | USD | N | N | |
Enterprise Value | ev | USD | N | N | |
Enterprise Value over EBIT | evebit | ratio | N | N | |
Enterprise Value over EBITDA | evebitda | ratio | N | N | |
Free Cash Flow | fcf | currency | N | N | |
Free Cash Flow per Share | fcfps | currency/share | N | N | |
Foreign Currency to USD Exchange Rate | fxusd | ratio | N | N | |
Gross Profit | gp | currency | N | N | |
Gross Margin | grossmargin | ratio | N | N | |
Goodwill and Intangible Assets | intangibles | currency | N | N | |
Interest Expense | intexp | currency | N | N | |
Invested Capital | invcap | currency | N | N | |
Invested Capital Average | invcapavg | currency | N | N | |
Inventory | inventory | currency | N | N | |
Investments | investments | currency | N | N | |
Investments Current | investmentsc | currency | N | N | |
Investments Non-Current | investmentsnc | currency | N | N | |
Total Liabilities | liabilities | currency | N | N | |
Current Liabilities | liabilitiesc | currency | N | N | |
Liabilities Non-Current | liabilitiesnc | currency | N | N | |
Market Capitalization | marketcap | USD | N | N | |
Net Cash Flow / Change in Cash & Cash Equivalents | ncf | currency | N | N | |
Net Cash Flow - Business Acquisitions and Disposals | ncfbus | currency | N | N | |
Issuance (Purchase) of Equity Shares | ncfcommon | currency | N | N | |
Issuance (Repayment) of Debt Securities | ncfdebt | currency | N | N | |
Payment of Dividends & Other Cash Distributions | ncfdiv | currency | N | N | |
Net Cash Flow from Financing | ncff | currency | N | N | |
Net Cash Flow from Investing | ncfi | currency | N | N | |
Net Cash Flow - Investment Acquisitions and Disposals | ncfinv | currency | N | N | |
Net Cash Flow from Operations | ncfo | currency | N | N | |
Effect of Exchange Rate Changes on Cash | ncfx | currency | N | N | |
Net Income | netinc | currency | N | N | |
Net Income Common Stock | netinccmn | currency | N | N | |
Net Income Common Stock (USD) | netinccmnusd | USD | N | N | |
Net Loss Income from Discontinued Operations | netincdis | currency | N | N | |
Net Income to Non-Controlling Interests | netincnci | currency | N | N | |
Profit Margin | netmargin | ratio | N | N | |
Operating Expenses | opex | currency | N | N | |
Operating Income | opinc | currency | N | N | |
Trade and Non-Trade Payables | payables | currency | N | N | |
Payout Ratio | payoutratio | ratio | N | N | |
Price to Book Value | pb | ratio | N | N | |
Price Earnings (Damodaran Method) | pe | ratio | N | N | |
Price to Earnings Ratio | pe1 | ratio | N | N | |
Property Plant & Equipment Net | ppnenet | currency | N | N | |
Preferred Dividends Income Statement Impact | prefdivis | currency | N | N | |
Share Price (Adjusted Close) | price | USD/share | N | N | |
Price Sales (Damodaran Method) | ps | ratio | N | N | |
Price to Sales Ratio | ps1 | ratio | N | N | |
Trade and Non-Trade Receivables | receivables | currency | N | N | |
Accumulated Retained Earnings (Deficit) | retearn | currency | N | N | |
Revenues | revenue | currency | N | N | |
Revenues (USD) | revenueusd | USD | N | N | |
Research and Development Expense | rnd | currency | N | N | |
Return on Average Assets | roa | ratio | N | N | |
Return on Average Equity | roe | ratio | N | N | |
Return on Invested Capital | roic | ratio | N | N | |
Return on Sales | ros | ratio | N | N | |
Share Based Compensation | sbcomp | currency | N | N | |
Selling General and Administrative Expense | sgna | currency | N | N | |
Share Factor | sharefactor | ratio | N | N | |
Shares (Basic) | sharesbas | units | N | N | |
Weighted Average Shares | shareswa | units | N | N | |
Weighted Average Shares Diluted | shareswadil | units | N | N | |
Sales per Share | sps | USD/share | N | N | |
Tangible Asset Value | tangibles | currency | N | N | |
Tax Assets | taxassets | currency | N | N | |
Income Tax Expense | taxexp | currency | N | N | |
Tax Liabilities | taxliabilities | currency | N | N | |
Tangible Assets Book Value per Share | tbvps | currency/share | N | N | |
Working Capital | workingcapital | currency | N | N |
The table is queried via the following endpoint:
The queries are authenticated and filtered using query parameters. A query parameter specifies a particular option or filter for the data to be returned. Examples of query parameter include the data format to be returned (format), the table columns to return (fields) or a filter to be applied (tablename). These are appended to the endpoint above, following a ?. The most important of these is your API key (api_key) which is used to authenticate you. Without a valid API key, results will not be returned.
The fundamentals table supports the following query parameters:
| Parameter | Description | Default | Examples |
|---|---|---|---|
| format | The format of the results to be returned. | csv | format=json |
| years | Triggers a bulk download of the full table as a compressed CSV. Values: 5, 10, or full. The API redirects to a time-limited download URL. | years=5 | |
| from | Specifies the filing date from which to return data. | 1 year ago | from=2023-08-01 |
| to | Specifies the filing date to return data until. | prior day | to=2023-08-31 |
| fields | The fields (table columns) to return. | all | fields=ticker,date,dimension,revenue,cor |
| calendardate | Specifies the calendardate for which to return data. | calendardate=2023-08-31 | |
| dimension | Specifies the reporting dimension of the data. | all | dimension=MRT |
| lastupdated | Specifies the last date on which a record was updated. This can be used to retrieve recently updated records. | lastupdated.gte=2023-09-31 | |
| ticker | Returns results for the specified ticker. Multiple tickers should be separated with a comma(,). | all | calendardate=2023-08-31 |
| limit | The number of records to return. | 10000 | limit=10000 |
| skip | The number of results to skip before returning data. Alias: offset. | 0 | skip=10000 |
| sort | The field used to sort the data and the sort method (asc/desc). | date.desc | sort=indicator.asc |
Retrieve the PostgreSQL schema:
Retrieve the SQLite schema:
Retrieve the MySQL schema:
Return fundamentals data for a ticker:
Return fundamentals data for multiple tickers:
Return fundamentals data for a specified ticker and reporting dimension:
Return fundamentals data that has been updated since a specified date:
Return fundamentals data for a specified ticker and dimension where the filing date is greater than a specified date, columns returned are limited to specified fields and the data is sorted by a specified field:
In Google Sheets, retrieve fundamentals for a single ticker (AAPL) with IMPORTDATA. You can change the query parameters (ticker, dates, fields, filters, and so on) in the same way as the Examples in the preceding section. Paste this formula into a cell (A1):
=IMPORTDATA("https://api.sharadar.com/v1.0/data/fundamentals?api_key=test-api-key&format=csv&ticker=AAPL")Download the [fundamentals] table as a compressed CSV by setting years to 5, 10, or full. The API responds with a redirect to a time-limited download URL:
Example using curl (follow redirects and write the file):
curl -L -o fundamentals.csv.zip "https://api.sharadar.com/v1.0/data/fundamentals?api_key=test-api-key&years=full"Check bulk file status (all history lengths present in storage):
Example response:
{
  "table": "fundamentals",
  "name": "fundamentals.csv.zip",
  "size": 650950030,
  "sizeLabel": "620.8 MB",
  "modified": "2026-07-16T03:57:16.344000+00:00"
}Since there are a number of ways to look at company financials, the fundamentals data is delivered in multiple time dimensions. These are outlined in the table below.
| DIMENSIONS | AS REPORTED | MOST-RECENT REPORTED |
|---|---|---|
| Annual | ARY | MRY |
| Quarterly | ARQ | MRQ |
| Trailing Twelve Months | ART | MRT |
As Reported view (AR)
- excludes restatements
- point-in-time view with data time-indexed to the date the form 10 regulatory filing was submitted to the SEC
- presents data for the latest reporting period at that filing date
- may include multiple observations in a quarter if more than one filing is made during the quarter
- on limited occassion may not have any observations in a particular quarter. Sometimes companies are delayed in reporting for up to 18 months. On such occassions they may report multiple documents on the same date to catch up, in which case these datasets will only provide date for the most recent reporting period.
- typically suitable for back-testing
Most-Recent Reported view (MR)
- includes restatements
- time indexed to the financial/report period
- presents the most recently reported data for that reporting period
- typically suitable for assessing business performance after restatements for mergers/divestitures
Time Dimensions
- Annual (Y): Annual observations of one year duration
- Trailing Twelve Months (T): Quarterly observations of one year duration
- Quarterly (Q): Quarterly observations of quarterly duration (available only for US domestic companies, unavailable for foreign companies)
When companies restate financials for prior reporting periods, the MR dimensions are updated to reflect these changes. For example, Post Holdings, Inc. (POST) restated their revenue for prior year financials. This can be seen in the chart below as the difference between the AR and MR revenue dimensions.
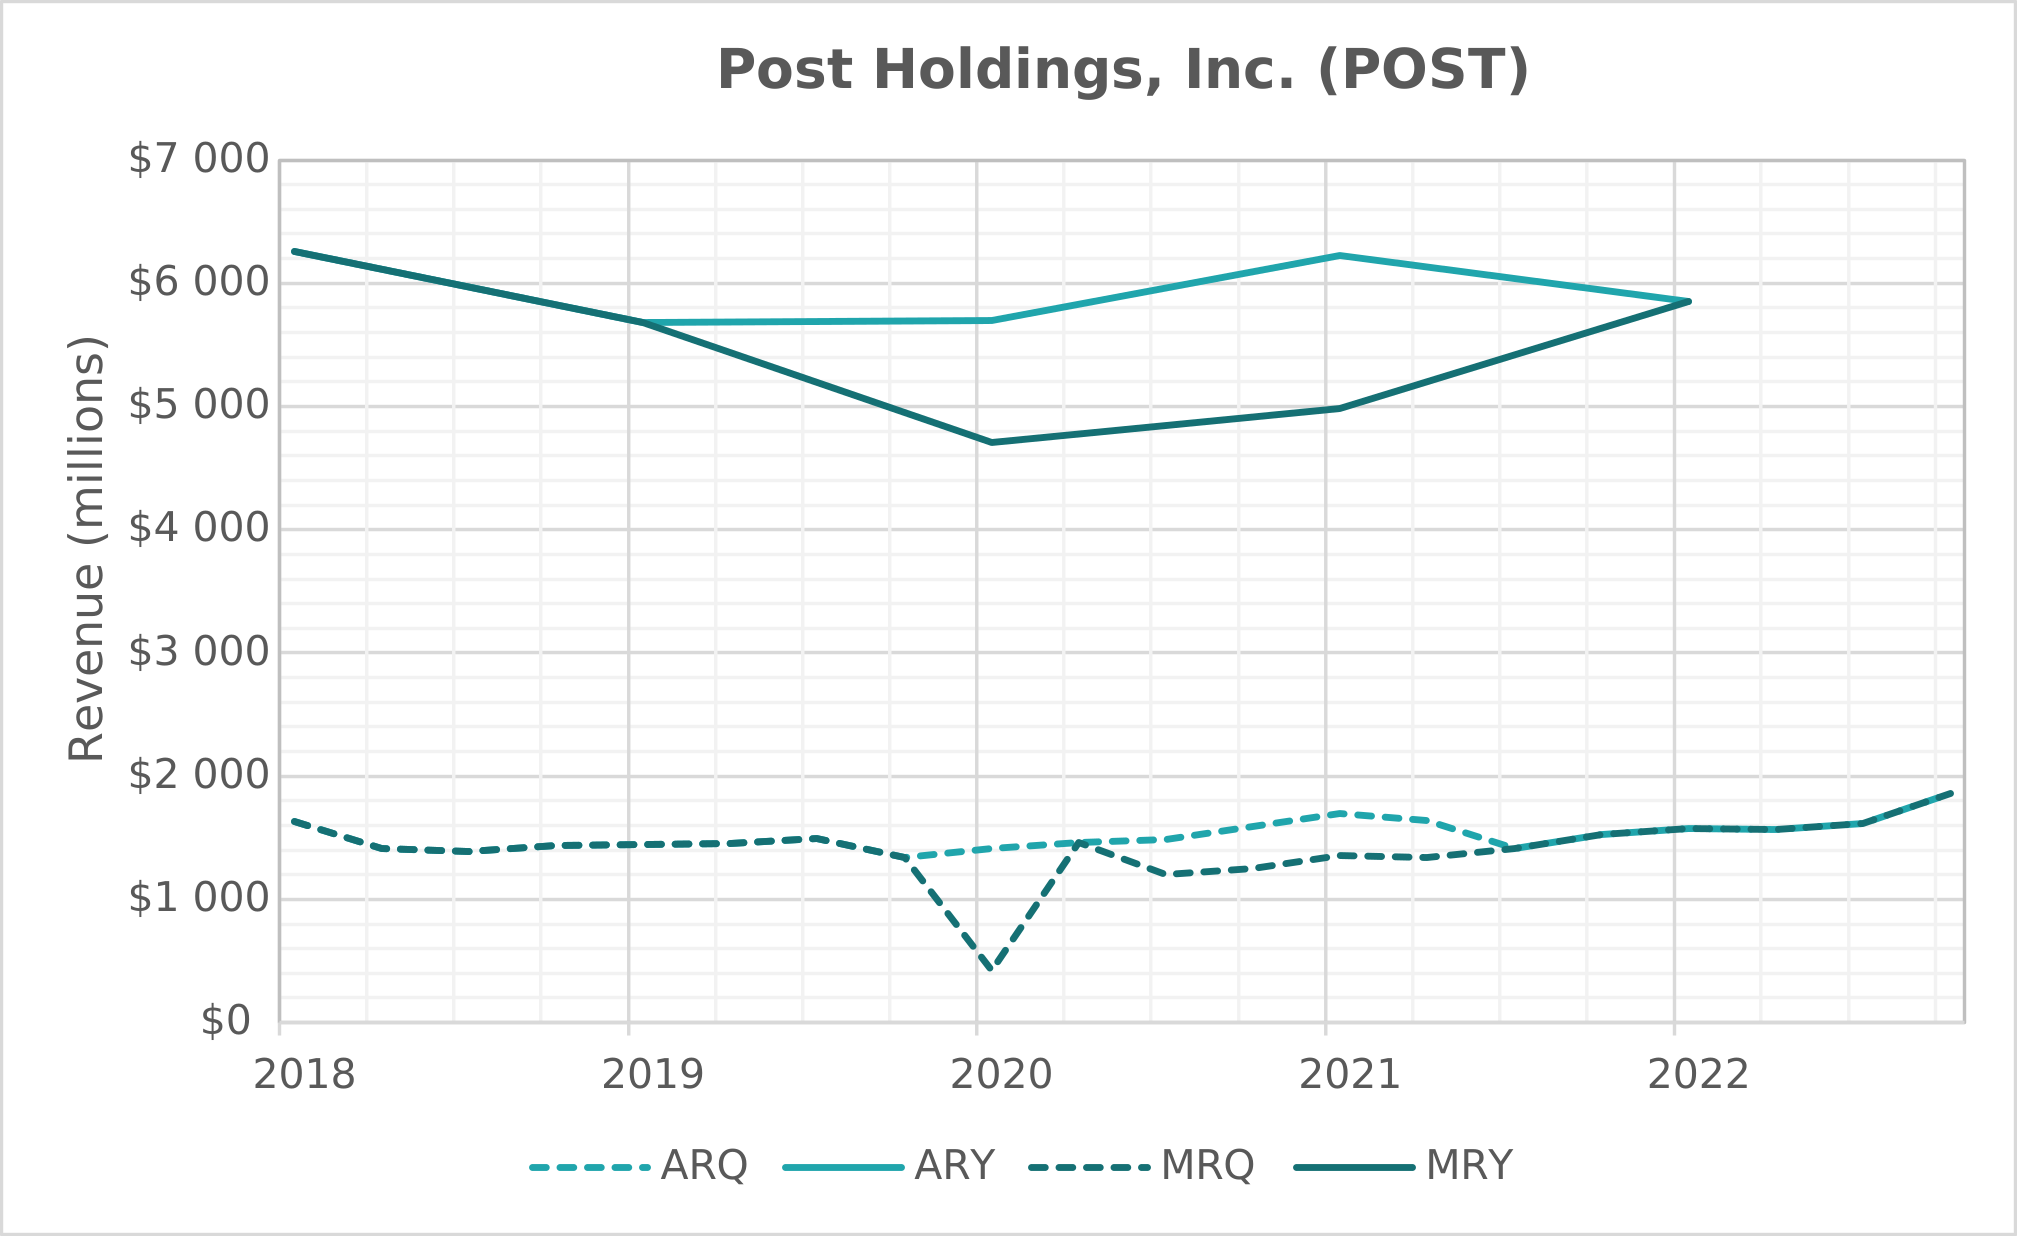
It is important to note that when the quarterly values are not restated (as in 2020 in the chart), the entire impact of the restatement will be captured in the final MRQ data point. This is to ensure alignment between the quarterly and annual financials.
The As-Reported dimensions present a point-in-time view with data time-indexed to the date of the form 10 regulatory filing to the SEC.
This aligns more closely with the date that information was disseminated to the market, and the corresponding market impact and is a more accurate measure than the reporting period which the Most-Recent Reported dimensions utilize, which are typically months before the information reaches the market, and subject to restatement.
It must be noted that the fundamentals data is based on the form 10 filings and the information may have been separately disclosed to the market days (or on rare occassion - weeks) earlier under separate form 8 regulatory filing.